Libertex Online CFD Trading – Introduction
Trading in Financial Markets
In Libertex , you can trade CFDs on stocks, commodities CFDs, cryptocurrency CFDs, or indicesCFDs and more as well as invest in real shares .
Say you’re very familiar with Apple products because you always buy them and are always tracking the corporate news for any developments at the company, why not consider buying Apple stock? Then you won’t just be a customer anymore – you’ll be able to make your knowledge work for you.
If you want to hone your trading and investment skills effectively, you need to do more than just watch videos: practice after each lesson is an absolute must.
As a trader, it’s crucial that you learn to control risk. This will become the cornerstone of your stability and will help you to treat your capital wisely.
Start a Trade CFDs in Libertex
In order to trade CFDs on the financial markets, you may stick to a trading strategies.
A trading strategy answers the following questions:
– What should you trade with ?
– In which direction should you open a trade?
– When should you close a trade if it isn’t successful?
– When should you close a trade if you made the right decision?
– Which amount and multiplier should be used in every specific trade?
Traders often use multiple trading strategies at once in order to try to minimize risk. Sometimes, instead of their own solutions, they use ready-made solutions aspiring to get results right away.
Starting Trading Live
Training in trading is an ongoing process. You cannot learn everything on a demo account. Since the process of trading in a live account is fundamentally different from trading in a demo account from the psychological standpoint.
When training, try to alternate acquiring new knowledge and practice: I learned, I tried, I learned, I tried, and so on. Only the knowledge strengthened by practice will help you achieve high levels of progress in learning.
Make a trade in a live account on the first day. You can make it “at random”. It is also important here to specify the minimum amount . In 1 hour, close the trade, regardless of the result. According to experienced traders, you will learn more from one such trade in a live account than from 100 trades in a demo account.
Deposit Money into your Account
It is impossible to obtain all the knowledge about trading. Go to a live account and start real trading with a minimum amount on the first day. You can quickly add funds to your account in any way convenient for you from the list of available methods.
Take care in advance to set up everything for withdrawing funds so that you can easily do it at any convenient time.
Check different methods for depositing and withdrawing funds in order to choose the most convenient method for you.
The 3 Rules of Trading
There are three main statuses of the movement of market charts:
– Uptrend – to try to increase the chances of success, you may make only buy trades.
– Downtrend – to try to increase the chances of success, you may make only sell trades.
– Sideways trend (price fluctuates in a horizontal channel) – you can make trades in any direction, depending on other methods of analysis, or just refrain from trading altogether. To try to increase your chances of success, make trades in the direction of the trend!
Making trades with a risk of no more than 2% of the capital for each individual trade is very important. You will feel more psychologically comfortable, and you will be able to be more disciplined, which may positively affect your performance.
Experienced participants in financial markets comply with the ratio of profit to risk of 2 to 1 or greater. In this case, even if there are 2 wrong decisions for every right decision, you will still have a stable result.
About Trading Hours
Activity on the markets is different at different times of day. For example, the Japanese yen is more dynamic during the Asian trading session, and the Australian and New Zealand dollar are more active during the Pacific session. However, the market is at its most active when the European and North American trading sessions are both active simultaneously.
Keep an eye on underlying assets trading hours. If you want to trade CFDs on Apple shares but it’s midnight in the US, you’re going to be disappointed. You can always find each underlying asset’s trading hours in the specifications of Libertex website or directly on the trading platform.
The emergence of very important news will typically provoke anomalous movement on the market. To try to increase your chance of success, prepare for these kinds of events in advance and adjust your trading plans accordingly.
About Time Frames
Experiment with switching the chart’s time scales in order to see how the appearance of a certain price fluctuation changes.
When using candlestick charts, make sure you analyze the situation again after each candle has formed fully.
This means you’ll want to analyze a one-minute chart every minute. In other words, keep your eyes more or less glued to the terminal. Analyze a five-minute chart every five minutes. A one-hour chart once per hour. A daily chart once each day. Keep this fact in mind when choosing a time frame that’s
convenient for you.
If you’re unable to find a chart scale that’s convenient for you on Libertex platform, with Libertex you can use other trading platforms such as MetaTrader4 or metaTrader5 for this.
Trading on the News
When you look at a calendar of economic news, focus on the indicator of a news story’s importance. First of all, choose the most significant news for the market.
If you’re trying to make trades to get results as quickly as possible, the news is one of the few instruments that might help you do this. Prices shift very quickly when new information is released.
Even if you aren’t planning to use a “trading on the news” strategy, you still have to know when important news is released as it can affect your open trades. If your target levels of profit and risk are far from the current price, there’s nothing to worry about. However, if there’s a chance they might be
reached following post-news price fluctuations, you’ll want to consider:
– closing the trade 30 minutes before an important news story is released
– changing your take profit and stop loss orders to try to reduce potential risks
The Multiplier
When making trades, try to make sure you never risk more than 2% of your trading account balance on any one trade. Say you have 1,000€ in your account, 2% of that is 20€. So you want to make it so that if you lose money on the trade, the most you can lose is 20€. Expert opinion: choosing a trade amount according to the size of your deposit is how you manage your capital. Wisely managing your capital aims to help you maximise performance.
If you’ve only just started trading and your strategy is still in the testing phase, use the minimum multiplier and trade amount. This will allow you to minimize your risk, while also gaining some valuable experience. Once you’ve made 10-15 trades, you can gradually increase the trading amount and try trading with multiplier.
Stop Loss
You can determine the size of your stop loss in two ways:
1. By price (based on the price level shown on the chart). It is a common practice to place your stop loss where the chart shifts, i.e. when upward movement is replaced by downward movement and vice versa. Levels of support and resistance can help here. You’ll learn more about them in future articles. Your stop loss may go just after the closest support or resistance level. You set your stop loss at the price (value) you
want and enter on the platform.
2. It should be based on the amount you’re willing to lose on the trade. For example, let’s say you’ve already calculated that you’re willing to lose no more than 20€ on any given trade. Just enter this amount when you open the trade.
Don’t set the stop loss too close to the current value. It could be set off by ordinary chart fluctuations. Don’t set the stop loss too far away as then there’s no point having one at all. If you can’t set a stop loss at a moderate distance from the value, just walk away from the trade.
The most experienced Traders set a stop loss on every trade.
Take Profit
Don’t forget about the ratio of profit to risk in every trade. Experienced traders try to make trades only if the potential profit is more than twice the risk.
It is a common practice to set a stop loss after the nearest level (above the level of resistance or below the level of support). Conversely, your take profit may be set before the nearest level (below the resistance level or above the support level).
There are trading strategies where stop loss and take profit orders aren’t used. These are usually the preserve of only the most experienced of traders. We strongly recommend using these methods of limitation in your first trades. This way you can achieve more psychological comfort , while reducing the risk of making a mistake as a result of following emotion instead of logic.
Japanese Candlesticks
Candles are an essential tool that may help you spot a potential turning point in price before the competition. The candlestick patterns we discussed in previous educational materials will enable you to find moments like these more effectively.
The longer a candle’s shadow is, the higher the chance of movement in the opposite direction. As a rule, long shadows signal increasing volatility. In other words, the price is changing quickly, and this increases your potential profit and risk as well.
If you prefer short-term trades that don’t last more than a few hours, use single-candle models.
Libertex Example Trades
Trading CFDs with market news
You can use market news as your sole way to trade CFDs on the market or as part of your own wider trading strategy. This may be a part of the risk management strategy.
If you always work with the same specific commodities and shares and are keeping an eye out for any new developments before acting, keep your other one on the market news.
Increasing the Trade Amount
When you open a position, you might not be completely certain that the price is going to move in the right direction. You can open a trade with a smaller deposit than usual. However, if it turns out you made the right decision and your degree of, certainty rises, you can always increase the size of your stake.
Keep your emotions in check and be sure to stick to the rules of your trading system. If the price continues to move in the right direction, try to limit yourself to increasing your stake by a maximum of 2 to 3 times its original amount. Otherwise the trade could end up in the high-risk zone in the event of a serious correction.
One of the most common mistakes among traders is increasing stake size in the high-risk zone, when the price is going in the opposite direction. This can lead to a sudden increase in risk and substantial losses, so try not to make this mistake.
The Fundamentals about Oil CFDs
When the US oil reserves data is released each Wednesday, oil prices can be impacted significantly. Usually, if oil reserves increase, the price goes down. If, however, oil reserves contract, then the price goes up.
Natural events such as a hurricane in the Gulf of Mexico can also affect oil prices. Once this kind of threat appears, oilprices typically start to increase.
There are several brands of oil. If you aren’t sure which one to focus on, choose any of them. Their price movements are very closely linked.
Crypto CFDs is not for Beginners
Before you start trading crypto CFDs, in addition to volatility, there are two other factors you should consider. Tendency toward trend: the tendency of the chart to show lengthy movements in one direction, as well as the fee you will pay per trade.
Try not to trade only cryptocurrency CFDs . Be sure to look at other underlying assets such as Forex CFDs, stocks CFDs, indices CFDs, and commodities CFDs, too. This will allow you manage the risks inherent to trading with crypto CFDs.
A chart is a chart, wherever you are in the world. When analysing cryptocurrencies, use the same analysis tools you would usually use to analyze price fluctuations in other underlying assets. It all works the same way.
Trading during the cannabis legalization hype
Check ordinary news sources from time to time. If you see information about increased demand for a certain company’s shares or a given commodity, this is a good sign that a boom is beginning.
You can use any market analysis methods you like to analyse commodities that are experiencing a boom. Unlike ordinary underlying assets, scenarios like these are characterised by anomalously large trends and extremely high volatility.
A Netflix case study
Keep track of any new products released by the companies whose stock you’re investing in. New products and achievements can have a positive effect on the company’s share price. By the same token, if a company experiences problems, it might be time to sell.
The most important news for a company is its quarterly report. These reports are released four times a year, and investors actively buy or sell stocks when quarterly reports come out. Keep in mind that, as a rule, quarterly reports are released outside of trading hours. To find out what this means: read the expert opinion given in the “Trading hours” section.
As share prices increase in value, the holders of such shares are occasionally paid dividends. This happens no more frequently than once a quarter, and it doesn’t happen for all stocks, but it can be a nice bonus if you have investments and/or open trades with stocks CFDs. To learn more about when this happens, check the specification for the corresponding stock.
How to Reinvest your potential Profit
Reinvesting your paper profit from a trade is an effective tactic when holding a position. Set a frequency (for example, once a month) for reinvesting your potential positive results into open trades.
It’s a good idea to determine the minimum amount of profit you plan to reinvest. If you reach this amount, you may reinvest it. When starting out, always try to use stop loss and take profit orders. That way, you can try to control your risks better.
Why is Libertex preferred by Traders?
The mobile application is great for opening positions, monitoring open trades, and keeping track of the latest news and market developments. But if you want to study a new underlying asset, make use of indicators, or check what the maximum value of a given underlying asset was three days ago, it is more convenient to use the Libertex online trading platform.
You can find all of the most popular technical analysis tools on the platform There’s also a version of the Libertex trading platform that’s optimised for tablets – it’s user- friendly and is perfect for on-the-go trading!
Examples of Trading Strategies
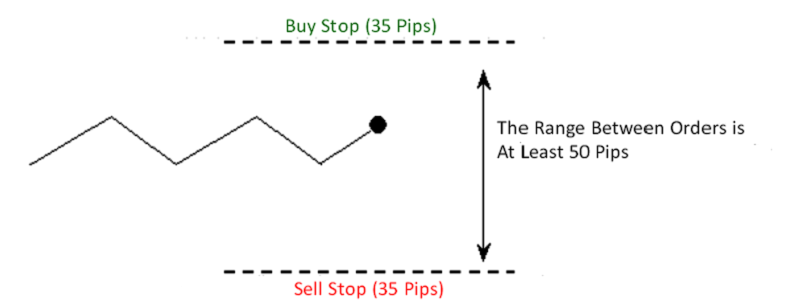
The NonFarm PayRolls Strategy
Make a habit of opening the economic calendar on the first day of the month and finding out the date and time when the newsnwill come out. News is always released on the second Friday ofmthe month (not the first). Once you’ve found the date and time, mark it on your calendar/day planner. That way, you’ll never
miss the news.
There’s always a large degree of uncertainty when it comes to the news largely due to the great speed with which generates price changes and profits. This is what draws traders to trading on Nonfarm data. It’s very important to keep a cool head and use a consistent strategy. And that means doing the same thing month in, month out.
This strategy is a great addition to your system. You only have to think about it once a month and you may use this additional strategy for trading.
![]()
![]()
The Evening Star Strategy
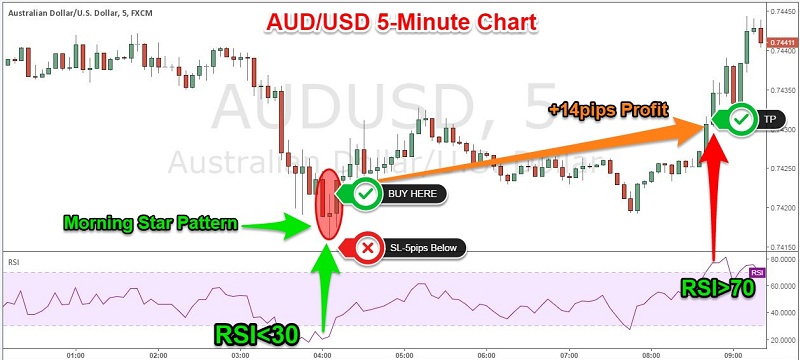
A large white candlestick followed by a smaller white candle; then there’s another big one, but this time it’s black. This is what the Evening Star candlestick configuration looks like. It’s a very strong reversal pattern, but make sure you confirm other technical analysis tools to increase your chances.
You can experiment with the strategy by setting a take profit with a profit/risk ratio of, say, two to one.
If the candlestick pattern is of moderate-to-small size, then the potential for movement is less, but so too is the risk. Whereas in larger candles, your stop loss will be commensurately bigger. There will be some cases where the stop loss is so high that you simply have to walk away from the trade.
The 240 minutes Strategy
A combination of multiple time frames is used in many strategies. For example, if a trader is trading for 15 minutes, they can evaluate hourly charts and daily charts in order to work only in the direction of global trends.
The principle of working this way is the same as in the Hammer strategy, except the entry point is determined at the smallest scale.
If you’re planning to open a mid-term trade and important news comes out the same day, we recommend trying to open a trade with an order at the moment the news story comes out according to your strategy. You might get a better price that way.
Trading Hammer Strategy
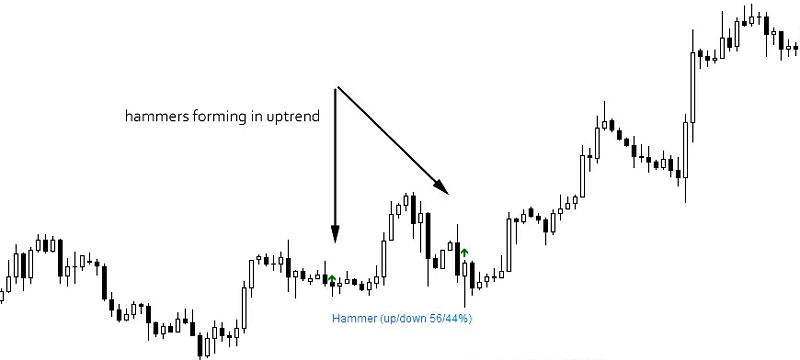
With the Hammer candlestick pattern, the colour of the body of the candle isn’t important. Rather, what matters is that the body is as small as possible. The smaller it is, the stronger the
pattern.
To increase your chance, try not to open trades in the same direction as the candle’s shadow. If the candle has a large upper shadow, you should refrain from opening long positions. Similarly, if its upper shadow is small, you should avoid short positions.
With the Hammer candlestick pattern, you also want the shadow to be as long as possible. The longer the shadow, the stronger the pattern. In such a scenario, you can set your stop loss order just below the level represented by the candle’s shadow.
The Piercing Pattern Strategy
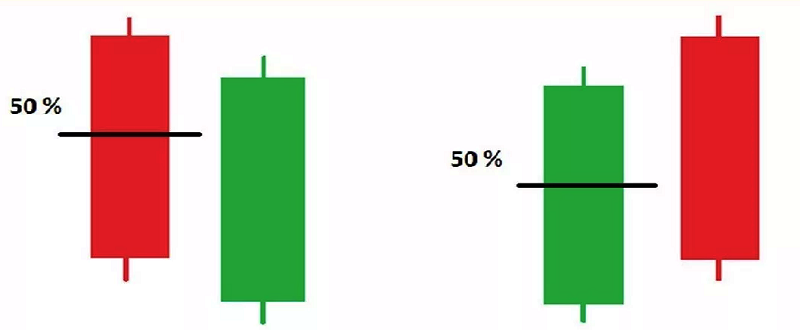
One key feature of the Piercing Pattern strategy is that the closing price of the second candle should be above the mid- point of the previous candle. It isn’t the strongest candlestick pattern, so you need to wait for the next candle to close in the same direction in which you want to open a position or use other technical analysis tools.
This approach is usually used for short-term trades as opposed to long-term ones. However, the details of individual trades don’t really matter that much. What matters is that you use a systematic approach and regularly make trades on the basis of this and other candlestick patterns.
The more clearly formed and visible a candlestick configuration is, the better the chances are . Incidentally, at the top of the market, when a downward trend is replaced by an upward one, this kind of candlestick configuration is called “Dark Cloud Cover”.
The Precise Step Strategy
Measured Move is a classical technique taken from graphical analysis. But in the classical version, the movements analyzed are of a larger scale then just a few candles.
You can use this tactic in any chart of any scale and with any underlying asset.
Always analyze the profit/risk ratio in the trade. The specific nature of this strategy is that the potential risk will be higher than the potential profit.
The Сrude oil reserves Strategy
This news comes out every week, and if oil reserves are low, it means the price of oil will increase. If they’re high, on theother hand, it will decrease.
You’re not tied to working with Brent oil – other brands are available. Just be aware that their prices might change in different ways. This is something you need to keep in mind. If you’re planning to open a position on oil CFD in the near future, this news could give help you find the right price at which to open it, just when the price is expected to rise.
The Trend Hunter Strategy
This strategy was used on four-hour charts and with the currency pairs CFD GBP/USD and CFD USD/JPY. If you want to try it with another underlying assets, you should first test and back-test it before finally trying it out for real with no multiplier.
This is an example of the simplest possible strategy. All key parameters for working systematically have been taken care of. This is ideal because, that way, the strategy allows you to focus on the theory instead of getting bogged down with rules: this is crucial for trading.
Three consecutive candles in a row constitutes confirmation by the chart that a trend is about to form. Don’t get scared if the price rolls back down after these candles. After all, waves and corrections are the natural order of the markets. Indeed, there are no movements which are not subject to corrections.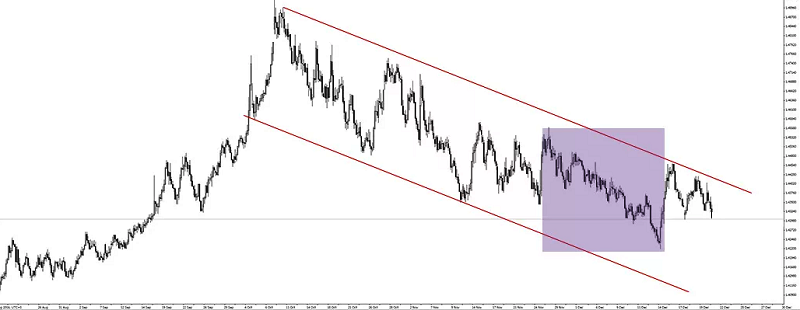
Identity Verification by Libertex
According to existing regulations every client of Libertex should be verified and answer the company’s questionnaire about the knowledge, experience, financial situation etc in order to be able to trade CFDs or invest in real shares.
To pass the process of verification smoothly and successfully, please read thoroughly following list of requirements:
a. As a proof of identity, you need to upload:
Double page of Valid Passport (both sides)
Other documents are not acceptable as a proof of identity.

b. As a proof of residence, you need to upload:
Full page of Bank Statement or Full page of Utility bill for landline services (Electricity, Gas, Water and Telephone) or Full page of residence certificate issued and certified by local administration. Proof or residence documents must not be older than 6 months.

Full page means that the 4 corners of the document are visible.
Rent agreements, mobile internet, sales slip receipts are not acceptable.
Libertex CFD Online Trading 
Risk warning: CFDs are complex instruments and come with a high risk of losing money rapidly due to leverage. 79% of retail investor accounts lose money when trading CFDs with this provider. You should consider whether you understand how CFDs work and whether you can afford to take the high risk of losing your money.
